
Would you believe that a 10% increase in the workload on your teams could double the length of a project?
With that in mind, do you even know what your current resource loading is?
In the last post I talked about a common project metric that was useless, misleading, and directly caused projects to take longer. (Hopefully you’ve stopped using “percent complete” by now.) This post is about a metric that is very common and happens to be critically important but is very underutilized because people don’t fully understand how it works and what to do when it’s “in the red”.
Part of the issue stems from the fact that at a high level the topic makes logical sense. “The busier you are the longer everything takes.” But what people don’t realize is the relationship between “busy” and “longer” is not linear. In fact it’s not even close. So let’s look at the curve.
 In the graph above, the vertical axis shows the cycle time for new work to go through a system, and the horizontal axis shows system loading from zero to one hundred percent.
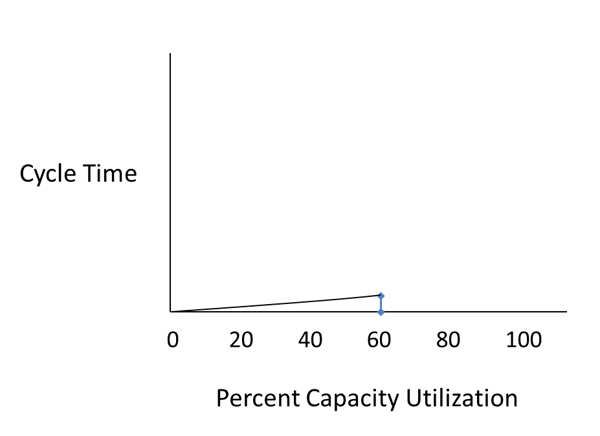
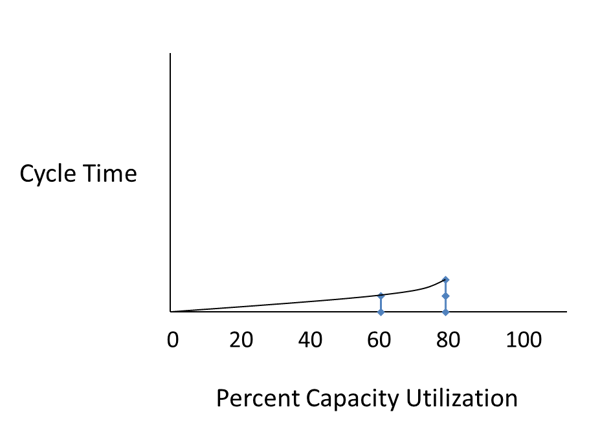
This first data point is at 60% system loading and you can see that it will take one unit of time for a new incoming task to be completed. The “one unit of time” can be one minute, one day, one week, one month, etc. So this is our baseline.
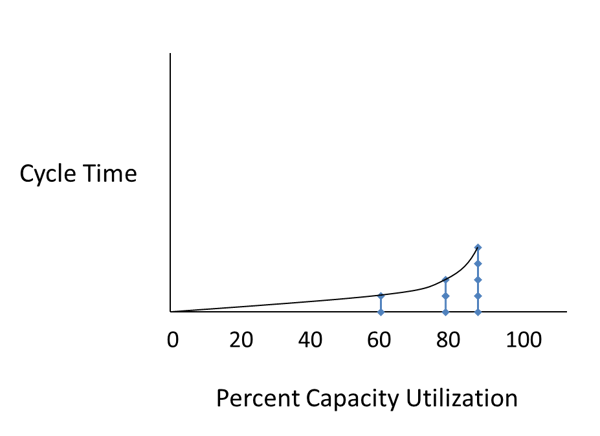
Then if you increase the loading of the system to 80% and measure the cycle time again you will see that it doubled. That’s surprising because we only increased our loading by 20% but the cycle time doubled?
And the graph below shows what happens when you increase the loading to 90%. The cycle time doubles again with just a 10% increase this time.
And here it is after doubling twice more—once at 95% and again at 97.5%...
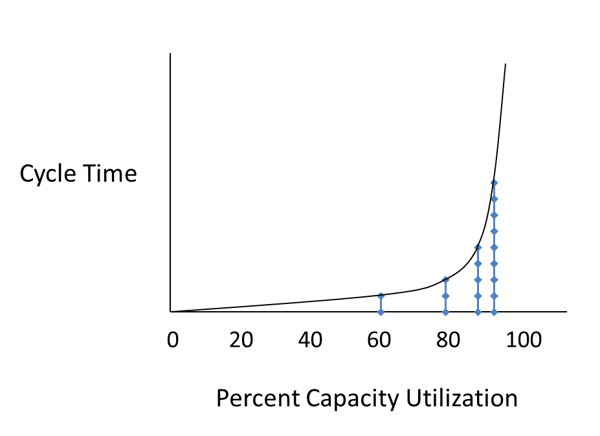
(Basically, each time you increase the loading from wherever you just measured to halfway to 100%, the cycle time doubles.)
So this is clearly non-linear.
what part of the curve are you on?
If you look at the curve there’s basically a portion that is nearly horizontal, and a portion that is nearly vertical. So changes in loading on the horizontal portion have a relatively small impact to cycle time, but changes on the vertical portion have a huge impact.
Can you guess what portion of this curve your current system loading is on?
If you’re not sure, do you have any of these symptoms…?
- Late projects
- Lots of multitasking
- Low morale (or high levels of frustration)
Resource Loading Maturity
There seems to be three levels of maturity when it comes to how well companies understand resource loading.
At the worst end, we have worked with companies that don’t even try to measure or account for it in their planning. For some reason they don’t think it would make any difference so it isn’t worth the effort. You can guess what level of symptoms they have.
In the middle, most companies at least try to manage it. But their typical method is to create a spreadsheet and assign each person a “percent allocation” to each project. And their total allocation across projects is usually 100%. This is a bit of an improvement but still inadequate for many reasons.
First of all, look at what happens at 100% loading on the graph again...
The last data point on the curve is at 97.5% so 100% loading would be off the chart.
And they are assuming that people can work eight hours per day, which is essentially impossible. When do they take breaks? Where do you account for switching costs due to multitasking across different projects? And what about interruptions?
Another factor that makes this worse is that many people on a project team are not even available eight hours per day. Many of them have work that is not part of a project plan. So their true availability for project work is more like six, four, or even two hours per day.
Now that you've seen this graph, image the impact of having a resource that has four hours of availability but gets assigned eight hours in a project plan. They are literally booked at 200% capacity over that time period.
One more thing to point out is that the graph above is for systems that have low variability in terms of the arrival rate and processing time of the work (e.g., manufacturing where the same steps are repeated exactly over and over). That is definitely not the case for R&D or any type of project work. These systems have work that is highly variable.
And the curve for systems with a lot of variability looks like this…
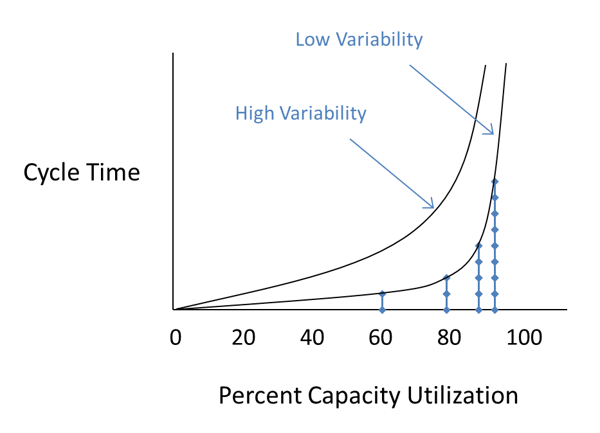
In other words, it’s important for these systems to have even more spare capacity.
With that in mind it's best to plan your projects with people loaded to 70% of their actual availability. And if you think that using a lower resource loading will cause the project to take longer, that is not the case. In fact, the opposite is true.
The highest velocity you can achieve requires spare capacity.
Don't forget the evil multitasking
There’s another problem with assigning people to multiple projects with an allocation percent. In their minds they are forced to multitask so they can show progress to each of the project managers that are going to ask for updates every week or two. As I mentioned at the beginning, we just wrote a blog about the terrible impact of multitasking here.
Bad Reactions
Another drawback to this very common level of resource management is what happens when companies see that resources are going to be overloaded at some point in the future. You basically have two choices…
- Ignore it (because you don’t believe it or can’t do anything about it)
- Hire additional resources
Believe it or not, ignoring it might be the right answer because hiring more resources might not fix the problem.
How is that possible?
Remember that one of our most important discoveries is that daily slips are usually the biggest cause of delays in most projects. (You can watch a short video that explains the impact and how Playbook resolves it with this link.)

These daily slips are caused by a lot of things that are interrelated (overloaded resources, incorrect plans, multitasking, etc.), but the end result is that people do not have correct priorities each day so…
…they are working on the wrong thing at the wrong time.
But the key thing to understand is that working on the wrong thing will only move the end date when the task is on the critical path.
And we also discovered recently that the average amount of slack in people’s tasks was almost six weeks. (You can read more about that in this post.)
That means that people are usually multitasking and incurring delays on tasks that are not even close to impacting the end date of the project…
So the solution to hire more resources in these cases would not impact the end date by a single day…!
But the conundrum is this is only true for most of the team members…
For a small number of them who are on the critical path these issues are very real and delaying your project right now.
Available Solutions
So what can we do about it?
If you are using traditional project management processes and tools you could have the project manager update the plan so that it’s accurate enough that you know what is on the critical path. That takes a lot of time and constant effort. But if you do it right you will at least know what work is critical and what isn’t.
The next step is to carefully look at their loading and adjust the durations of their work using five or six hours per day as their maximum capacity. And be sure to also move all of their work in the other project plans they’re assigned to because they won’t be able to get to it until they are off the critical path in this project.
If this is sounding impossible, you are right. But it’s the only choice for companies who are using traditional methods and tools.
Better Solutions
A much better solution is to use principles from lean manufacturing and agile software development and create a system where the team members pull their tasks from a prioritized backlog and mark them completed when they are done.
This has many benefits.
First of all having the team members update their own tasks will keep the plan up to date and ensure you have an accurate critical path. And everyone will know the relative criticality of their work (how likely it will impact the end date). So even if they are on multiple projects (or have a lot of non-project work to do) they can stay focused on the critical path work until it’s done. They (and everyone) will be able to see all of their non-critical path tasks sliding but will know it’s ok.
And because everyone knows the relative priority of all of their tasks, they can stop multitasking. So that wasteful behavior is instantly eliminated for everyone! 😀
The net result is the current state of near gridlock (even in overloaded systems) is eliminated and the throughput of the system goes up dramatically.
If you would like to see this process in action, watch this four-part demo series.
If you have questions about how to eliminate this problem at your company, or would like to see more details, set up a time to discuss them with me.
If you would like to read more about resource loading, there is a previous blog post here. If you don’t read the whole thing, at least read the Additional Thoughts and Footnotes at the end.
If you would like more details on the capacity loading curve, there is a detailed explanation in two books by our favorite author, Don Reinertsen.
Good luck and remember--pushing more work into a busy system does not make more work come out the other end!
