
Cost of delay is the difference in the value of doing something sooner vs. doing it later. The cost of delay of a new product development project is the amount of additional profit you would make by launching a product at an earlier time 'X' vs. launching at a later time 'Y'. It is the total profit-dollars lost per unit of time of delay, e.g., the total amount of dollars lost, per month, per week, or per day of delay.
Examining product life-cycle to understand profit
Although there are many different situations and scenarios for different types of projects and products, in most cases it is fairly easy to estimate this the cost of delay. In the images below, the green curve represents the money we expect to make (per month) if we launch on time. The area under the curve is the total cumulative profit we expect to make over the entire time period.
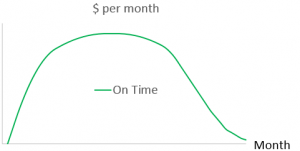
Figure 1: Monthly profit, projected for entire life-cycle
The forecast in the image above predicts sales for the complete product life-cycle. However it is unusual to predict sales for a full life-cycle for most hardware products.
As an example, medical device life-cycles are often 5 to 10 years or longer, but revenue and profit goals are more short-term. As such, forecasts are only made for the first several years of the life-cycle. The product life-cycle curve is cut short, as in the graph below where sales rates do not decline.
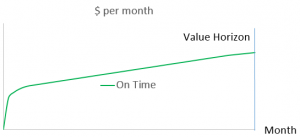
Figure 2: Monthly profit, projected for partial life-cycle
The numbers needed to build these profit curves are readily available as sales forecasts. They are typically developed early for a new product, and they can be combined with actual monthly sales volumes of similar products in the past. When combined, these figures give us a monthly forecast of projected profits.
What happens to profit when we are late to market?
Now let’s look at what happens to our profit when we are late to market. In the following images, the red or orange curve represents what happens if we are one month late.
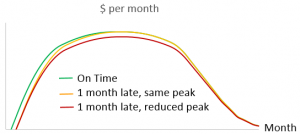
Figure 3: Monthly profit, projected for entire life-cycle, on time vs. 1 month late
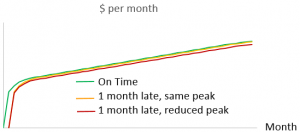
Figure 4: Monthly profit, projected for partial life-cycle - on time vs. 1 month late
As you can see, the total amount of money made is reduced when we are late to market. The area between each curve is the difference in cumulative profit. For example the difference between the green and the orange curve or the difference between the green and red curve is the difference in cumulative profit. This is the Cost of Delay.
See the next post in this series, where we learn how to quickly calculate the cost of delay of a product development project.
----
Want to learn more about how to calculate cost of delay? Download the eBook, "Profit Driven Development and Cost of Delay: A Guide for Decision Makers."

Related Posts
Cost of Delay: How to Calculate It
Cost of Delay and Project Modeling
Cost of Delay Project Model Examples
Cost of Delay Project Modeling Risk
Cost of Delay and Strategic Advantage
Cost of Delay: Project decisions based on profit
8 Ways to Decrease Risk in Project Decisions
14 Tips for Calculating Cost of Delay
Don Reinertsen on cost of delay
Editor's note: This post was originally published in 2015 and has been updated for accuracy and comprehensiveness.
